
Podiatry Google Ads Case Study: 835 Patient Actions at $26 Each
An anonymized sole-provider podiatry practice used separate Google Ads campaigns to control demand across two offices, generating 835 tracked new patient actions at a $26.06 blended cost per action.
On This Page
Bottom line: From January 6, 2025 through August 1, 2026, an anonymized New Jersey podiatry practice generated 835 tracked new patient actions from Google Ads at a $26.06 blended cost per action. The total includes online bookings and tracked calls over 120 seconds from patients who had never called the office before, not confirmed attended appointments.
Most Google Ads case studies lead with clicks, impressions, or a percentage that sounds impressive until you ask the only question that matters: did more prospective patients take action?
This one has a cleaner answer. From January 6, 2025 through August 1, 2026, an anonymized two-location New Jersey podiatry practice generated 835 tracked new patient actions from Google Ads at a blended cost of $26.06 each.
The owner had a more specific goal than growth for growth's sake. She wanted to remain the practice's sole provider while controlling demand independently at each office, making one location busier, easing demand at the other, or slowing both when her schedule was full.
Quick answer: The practice spent $21,758.29 to generate 835 tracked online bookings and calls lasting over 120 seconds from patients who had never called the office before. Separate campaigns turned Google Ads into an office-level demand control: each location could be scaled up or down according to the sole provider's schedule, while service-focused targeting and stricter tracking protected efficiency.
The Result: 835 Tracked New Patient Actions at $26.06 Each
Here is the warehouse-verified scorecard for the full available period:
| Metric | Result |
|---|---|
| Reporting period | January 6, 2025 to August 1, 2026 |
| Google Ads spend | $21,758.29 |
| Tracked new patient actions | 835 |
| Blended cost per action | $26.06 |
| Ad clicks | 9,207 |
| Click-to-action rate | 9.1% |
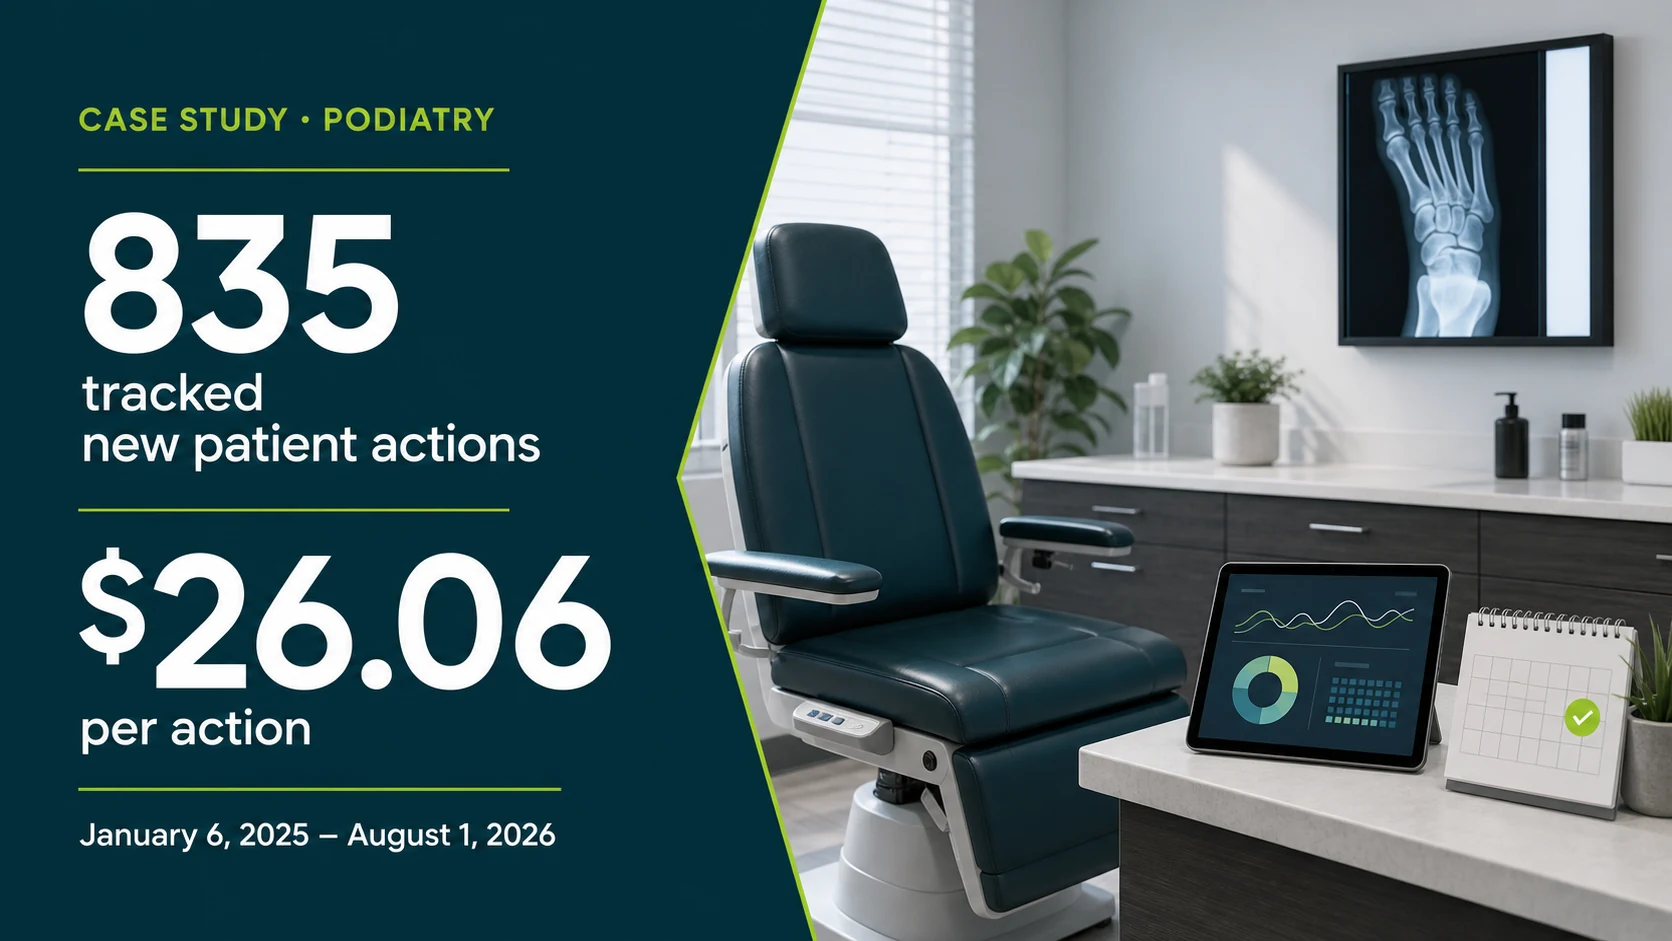
Warehouse-verified Google Ads results through August 1, 2026.
Measurement note: A tracked new patient action is an online booking or a tracked call over 120 seconds by a patient who had never called the office before. It is not the same as a confirmed attended appointment, and we do not present it that way. The warehouse separately verifies 276 online booking conversions within the conversion-action view's available lookback, but a July tracking interruption means that number should not be used as a current lifetime total yet.
The Starting Point: Referral Strength Without Predictable Search Demand
Like many established medical practices, this clinic already had a referral base. Referrals are valuable, but they are hard to scale on command. That was especially limiting for a sole provider dividing her time between two offices: she needed to direct demand toward the location with room in the schedule without committing to hiring another clinician.
Paid search offered a more controllable source of demand, but only if the account could answer three practical questions:
- Can each office reach patients searching in its real service area?
- Can the campaigns focus on conditions and services the podiatrists actually treat?
- Can reporting separate useful patient actions from noise?
That last question matters more than most agencies admit. A cheap conversion is meaningless when it is a wrong number, an existing patient calling the front desk, or a low-intent action that never reaches scheduling.
What We Changed in the Google Ads Account
1. Separate campaigns for separate offices
The practice's two locations had different economics and different capacity from week to week. We kept them in separate local search campaigns so each office could have its own budget, cost target, geography, and performance history. That gave the owner a practical control panel: increase demand where she wanted a busier schedule, ease the other office, or reduce both when her calendar was near capacity.
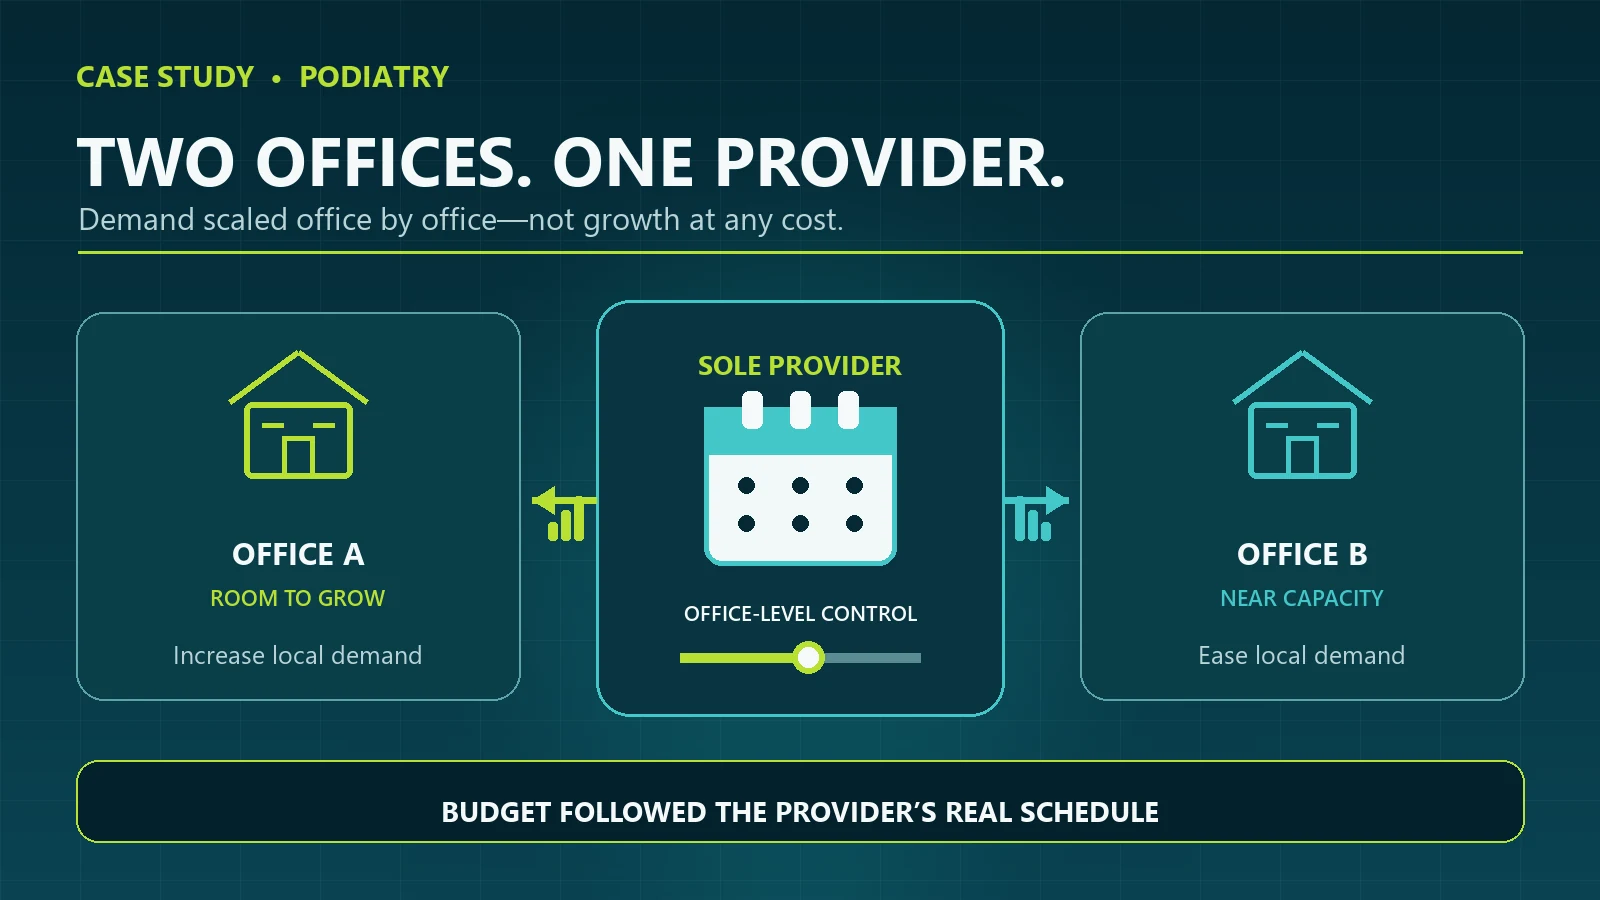
Separate campaigns let the owner increase or ease demand at each office around her real schedule.
2. Search themes built around real patient needs
The account expanded in deliberate service groups instead of adding one giant list of generic podiatry keywords. In May 2026 alone, 67 new terms were introduced across three themes:
- Local foot doctor and near-me searches from people actively looking for a provider
- Nail and fungus treatment searches tied to a specific clinical need
- Custom orthotics searches tied to a defined service line
The point was not to make the keyword count bigger. It was to cover more of the ways a qualified patient describes the problem they want solved.
3. Bidding targets set by campaign economics
Both campaigns used conversion-focused bidding with cost targets tuned to their own history. One office consistently produced lower-cost actions, while the other needed a higher target to remain competitive in its market. Treating both locations as identical would have hidden that difference.
4. Routine search-term cleanup
Every month, search terms were reviewed for obvious waste: definitions, research-only questions, unrelated providers, and queries that did not match booking intent. This is the unglamorous part of auditing a healthcare marketing budget, but it is what keeps broad reach from becoming broad waste.
The Scaling Month: Nearly 70 Actions at About $22 Each
May 2026 shows what the account could do at normal operating capacity. After late conversion adjustments in the warehouse, the month finished with 69.7 tracked new patient actions at $21.55 each on $1,501 in spend.
The campaign expansion was paired with bidding refinements, not launched into an uncontrolled account. The lower-cost office produced most of the volume, while the second location continued building its own local footprint. Mobile users accounted for the large majority of actions, reinforcing why a fast, low-friction scheduling experience matters. Our broader guide to turning healthcare website visitors into booked patients covers that handoff in more depth.
June remained efficient at 60 actions and $25.24 per action. During that month, the practice raised the quality threshold for tracked phone calls. A call had to last more than two and a half minutes before it counted as a new patient action. Online bookings held steady at 35, even though the stricter call standard made the blended total look lower.
That is a reporting improvement, not a marketing loss. Cleaner data gives the bidding system and the practice owner a more honest signal.
Why July's Lower Volume Was the Right Outcome
Good marketing should follow clinical capacity. It should not fill an office with demand the team cannot serve.
Because the owner remained the only provider, her availability was the practice's real capacity limit. When that availability dropped for a month, daily budgets were reduced by 85% from mid-July through mid-August. July spend fell from $1,515 to $844. The account still produced 31 tracked new patient actions at $27.24 each.
Volume declined because the practice intentionally bought less traffic. Efficiency stayed close to the long-run average. That is a healthier result than spending the normal budget, creating a scheduling backlog, and frustrating patients who cannot get an appointment.
This capacity-aware approach is one of the clearest differences between operating a patient-acquisition system and simply managing an ad account.
What the $26 Cost Per Action Actually Means
The headline is useful, but it needs context.
- It is a blended Google Ads result. It includes online bookings and tracked calls over 120 seconds from patients who had never called the office before.
- It is not a guarantee. Costs vary by market, competition, service mix, website experience, insurance positioning, and scheduling capacity.
- It is not a revenue figure. A practice still needs intake discipline and patient follow-through after the lead arrives.
- It is not a static account. Tracking definitions, budgets, search terms, and service coverage were actively maintained throughout the period.
The result is meaningful because it held across 19 months of available history, not because one unusually good week was turned into a headline.
Five Lessons for Podiatry Practices Using Google Ads
- Measure patient actions, not traffic. Clicks and impressions are diagnostic metrics. They are not the business outcome.
- Split locations when their economics differ. Separate budgets and targets make it easier to invest where capacity and efficiency align.
- Build around services and intent. A patient searching for toenail fungus treatment should not land in the same generic experience as someone looking for custom orthotics.
- Make tracking stricter over time. A lower conversion count can be good news when the removed actions were poor-quality calls.
- Pace demand to the schedule. The best campaign is not the one that generates the most leads. It is the one that generates the right amount of qualified demand at the right time.
The Bottom Line
This New Jersey podiatry practice did not need a viral campaign or a plan built around adding providers. It needed a durable local search system that let one clinician control demand across two offices: clear location structure, service-aligned search intent, honest conversion tracking, and budgets tied to where she wanted the schedule to grow.
The result through August 1, 2026 was 835 tracked new patient actions at $26.06 each. More important, the account could scale up when the schedule had room and slow down when capacity tightened without losing control of efficiency.
Ready to see results for your practice?
30-minute strategy call. Direct access to Kevin Dillon, an operator who's scaled healthcare businesses to Inc 5000. No account managers, no pitch deck, just answers.
Book a Free ConsultationMore Tips & Tricks

Construction Daily Report App Case Study: One Field Hub for Reports, Safety, and Photos
We built a daily operations app for a heavy civil contractor: daily reports, safety forms, and job photos in one place, built for bad signal and connected to Microsoft 365. Here is what we built, what 780 real reports taught us, and what this case study cannot prove.
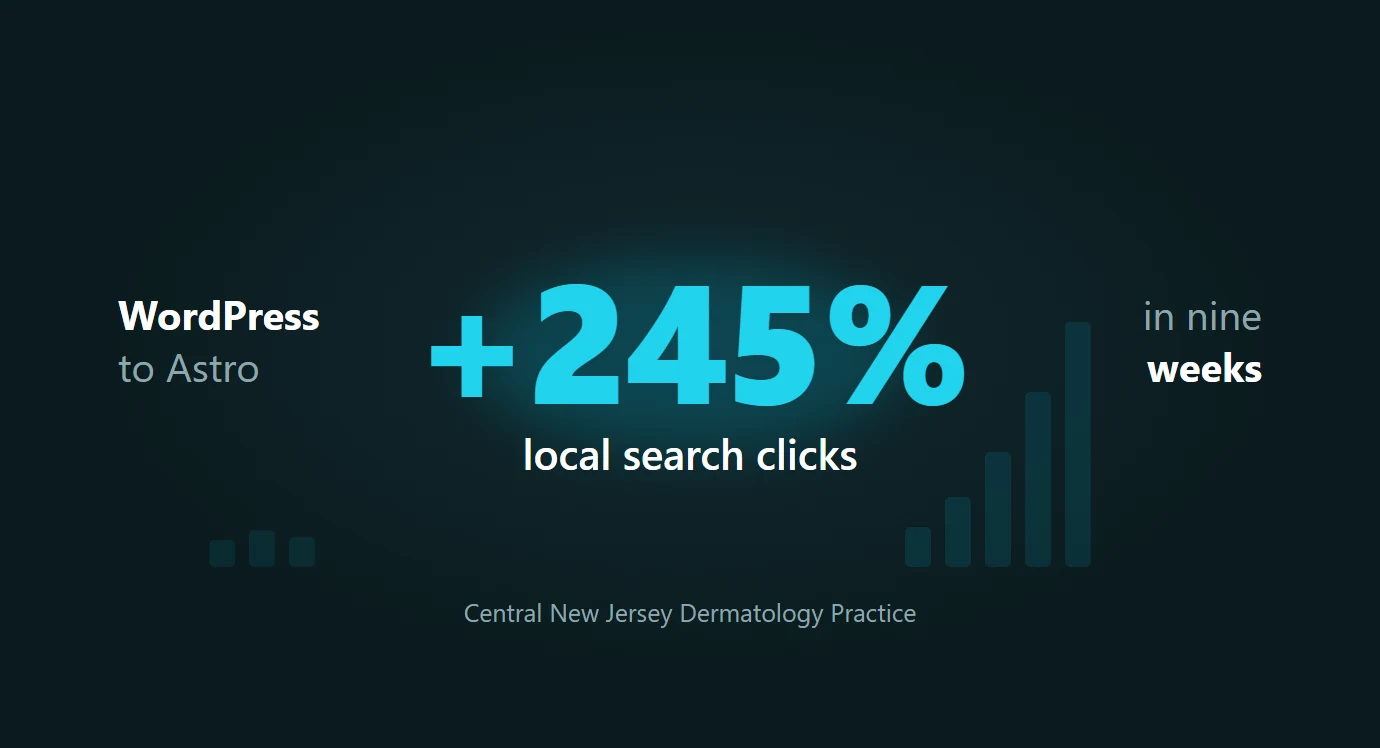
Healthcare Website Redesign: How One Practice Tripled Local Search Clicks
A central New Jersey dermatology practice was a subfolder on a WordPress domain it shared with a sister podiatry practice. Nine weeks after its redesign launched on a dedicated site, organic clicks were up 77% and local search clicks had tripled. Here is the full data from both Search Console properties.

What Should Dermatology Leads Cost? How One Practice Achieved $27 Per Lead
Dermatology lead cost is one of the most common questions practice owners ask about Google Ads. Are you overpaying? Is there room to improve? Or is this just what patient acquisition costs these days? Here’s a real…